At the university one of the cool features we have on the monitoring dashboard is to split it so services are monitored at 3 levels:
- Infrastructure
- Platform
- User Experience
If you imagine a table which looks something like this:
| Service | User | Platform | Infrastructure |
| API | |||
| Public Website | |||
| Identity Synchronisation | |||
| BizTalk | |||
| Office 365 |
This dashboard is based off System Centre monitoring different aspects of the system we have and then relating them to the user, platform or infrastructure level things. The idea is that while you may have some issues with some levels of a service, it may not impact users. We want a good view of the health of systems across the board.
When we consider how to plug BizTalk into this dashboard we have a few things to consider:
- SCOM has a management pack for BizTalk which can be used
- We can monitor event logs and services and other such things
The challenge comes at the point when we consider the user side of things. In our other systems we treat “User” to mean is the service performing the way it should for the consumers of that service. As an example we can check that web pages are being served correctly. In our API stack we use a pattern that Elton Stoneman and I have blogged about in the past where we have a diagnostics service within the API and we will call that from our monitoring software to ensure the component is working correctly. We would then plug this into the monitoring dashboard or perhaps you would plug it into the web endpoint monitor for BizTalk 360.
When it comes to BizTalk what is the best thing to do?
Our Approach
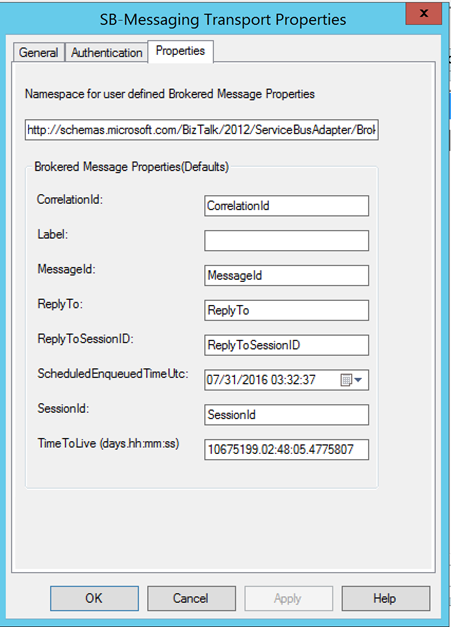
The approach I decided to take was to use the Diagnostics API approach where we would host an API in the cloud which would use the RPC pattern using Service Bus queues to send a message to a queue. BizTalk would then collect this message and take it through the message box and use a send port which would send the message to a response queue which the API would be checking for a response message. The API would set the session ID, reply to session Id as properties on the brokered message and in BizTalk I would flow these message properties from the receive to the send so that the message went back to service bus with the right session details so that the API would pick it up.
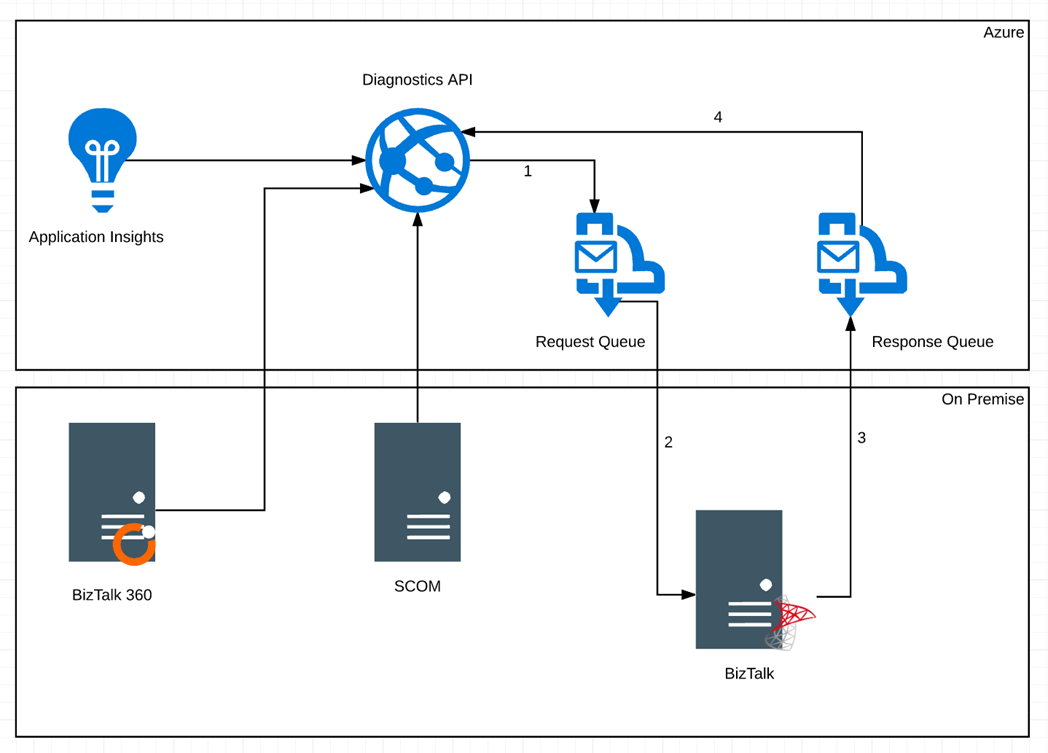
The below diagram shows how this would work.
- The Diagnostics API sends a message to the request queue
- BizTalk has a receive location pointing at the queue and collects the message
- A send port subscribes to the message and sends the message back to the response queue
- The API is listening on the response queue for the response message coming back
If the API gets a successful response then it will return an http 200 to indicate success
If the API gets an error of no message comes back then an http 500 error is returned
Limitations
The challenge for BizTalk is that the number of different interfaces you have means you have many dependencies and most often it is one of these dependencies breaks and it looks like BizTalk has problems when it doesn’t.
With this user level monitoring what we are saying is that BizTalk should and is capable of processing messages. This test ensures the message is going through BizTalk and flexes the message box database and other key resources. Obviously it doesn’t test every BizTalk host instance and any of the dependencies but it tells us that BizTalk should be capable of processing messages.
Implementation Specific Info
A little lower level detail on the implementation of this is provided below.
Service Bus
On the service bus side we have a request queue which is a basic queue where we have set permission for the API to send a message. The queue has all of the default settings except the following:
- The message time to live has been reduced to 1 day
- The queue size is set to 1GB
- Partitioning is disabled (this isn’t supported by BizTalk last time I checked)
The response queue has sessions enabled on it so that the API can use sessions to implement the RPC pattern. The settings are the default except for the following:
- The message time to live has been reduced to 1 day
- The queue size is set to 1GB
- Partitioning is disabled (this isn’t supported by BizTalk last time I checked)
BizTalk
On the BizTalk side we have a receive location which is using the SB-Messaging adapter and is pointing to the request queue. It is using all of the default settings and also we have left the service bus adapter property promotion set to on leaving the default namespace for properties.
We copied the namespace though for use on the send side. We set the properties to be flown through to the message sent back to service bus.
The BizTalk side is very easy it is just pass through messaging from one queue to another so there is very little that can do wrong.
Diagnostics API
At this point you should be able to ping your API to see that it will send a message to the request queue and that it gets a response meaning BizTalk processed the message. Using a simple WebAPI component here we could do an HTTP GET to a controller and using a simple approach of 200 HTTP response means it works and 500 means it didn’t you now have a simple diagnostics test which can be easily used. You might consider things like caching the response for a minute or so to ensure loads of messages aren’t sent through BizTalk or also using an access key to protect the API.
We then hosted the API on Azure App Service so its easily deployed and managed.
Monitoring the Diagnostics API
Now that our API is out there and can be used to check BizTalk is working we can plug it into our monitoring software in a few different ways. Some examples include:
- Plug it into Application Insights as a Web Test
- Call it from SCOM with an HTTP Get
- Plug it into BizTalk 360 using the Web Endpoint Monitor
I have talked about using the BizTalk 360 endpoint monitor in previous posts so this time lets consider Application Insights. In the real world I have found that sometimes customers setup BizTalk 360 in a way that if the BizTalk system goes down then it can also take out BizTalk 360. An example of this could be running your BizTalk 360 database on the BizTalk database cluster. If the SQL Server goes down then your BizTalk 360 monitoring can be affected. In this case I also like to compliment BizTalk 360 with a test running from Application Insights so that I have double checked my really key resources.
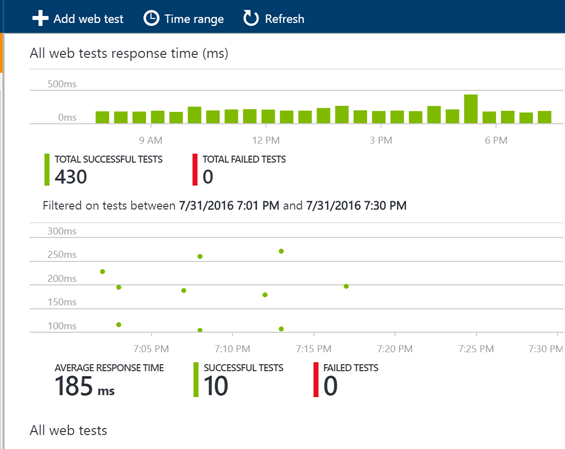
To plug the web test into Application Insights you would setup an instance in Azure and then go to the Web Tests area. From here you would setup a web test pinging BizTalk from multiple locations and you could simply supply the url just as if you were testing the availability of a web page. The only difference is that your page will respond having checked BizTalk could process a message.
If the service responds with an error for a few mins then you will get alerts to indicate BizTalk may be down.
Also you can see below there is quite a rich dashboard of when your tests are running and their results as shown below.


